Scanning Tunneling Microscopy
 Motivation
STM is known to be used for the investigation of surface topography. However,
we are more interested in the electronic properties of our samples which can be
analyzed by Scanning Tunneling Spectroscopy (STS). By measuring I-V characteristics, insight in the local density of states (DOS) at the sample
surface position at which the tip is located can be gained.
Requirements
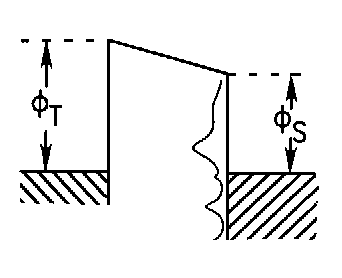
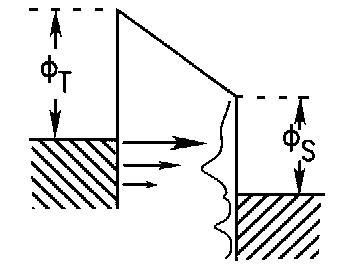
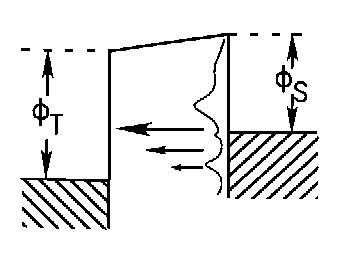
The tunneling current I is, in a simple approximation, proportional to the
DOS of the sample surface at the tip position and to the tip's DOS,
ρs and ρt,
respectively. Also, the tunneling matrix element T enters:
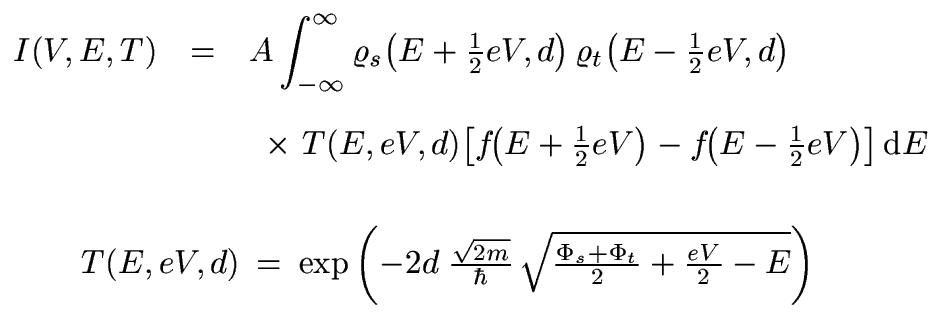
Here, d denotes the distance between tip and sample, V the applied
voltage and E the energy with respect to the Fermi energy EF. The Fermi functions f involved can most easily be
treated if the measurements are conducted at the lowest possible temperature:
at low temperatures they can be considered as step functions. Following the theory by
Tersoff and Hamann, the sample's local DOS at EF
is measured at tip center. However, a number of assumption concerning the tip has been made.
One of the major problems in STM/STS is its surface sensitivity. Physical (adsorbants)
or chemical (oxides) modifications can easily disturb any tunneling measurement.
The best what can be done about this is in situ cleaning and keep
the sample in UHV.
In order to achieve optimal resolution (spatially as well as energetically)
isolation against mechanical vibrations and electrical noise is important.
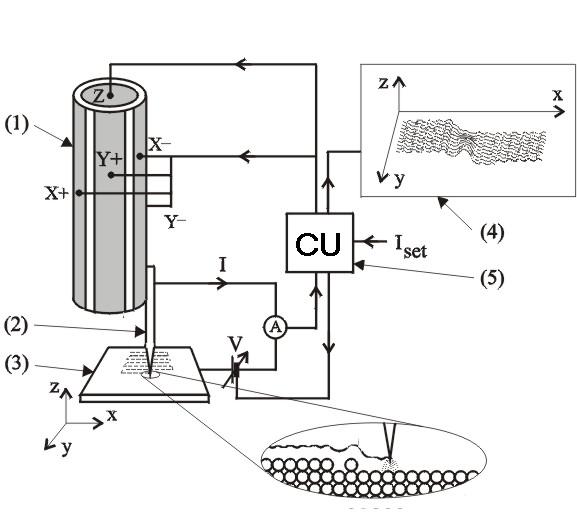
STM Principle
- A sharp-pointed tip (2) is physically attached to a piezo (1).
- A coarse drive (not shown) allows for coarse positioning of the tip with respect
to the sample. It usually enables movements in the μm- to mm-range.
- By using the piezo the tip is positioned in close proximity (sub- or lower nm-range
in z-direction) to the sample (3) to enable tunneling. For this, a bias
voltage is applied between tip and sample.
- The tip is scanned over the sample's surface (in x- and y-direction)
by applying the appropriate voltages to the piezo. Here, either the current is kept
constant (by keeping a constant local sample-tip distance) and the tip's absolute height
is changed accordingly (constant current mode) or vice versa (constant height
mode). This, of course, happens computer controlled (5).
- The resulting image (4) is constructed from the known displacement of the tip.
In constant current mode, the images correspond to planes of constant DOS at
EF (for low bias).
|
This scheme was taken from the web but I forgot the source's
location. Nonetheless, I thank the author. |
Spectroscopy